Anatomy of a Trade

I have often described my algorithm like this:
My algorithm's predictions can be compared to trying to predict the course of a ship in the sea. Most algorithms try to predict the course as a projection of where the ship has been and is currently headed, its patterns of movement, and its velocity. My algorithm predicts the position of the ship by looking at the change in the angle of the rudder and its velocity. What if I were able to put a camera, focused on the rudder, on the stern of a ship? I could see when the captain decided to change course in advance of the ship actually changing course.
The use of my algorithm should be understood in terms of the patterns of movements that will be encountered during the course of trading any individual stock or ETF.
This article explores some of the patterns and provides a foundation for understanding what I experience as a trader using my algorithm.
The first foundational pattern to be aware of is that the trade is a long term trade. On average, a trade using this system takes 310 days to complete for your average stock. Trading an ETF on the other hand, takes twice as long (and on average has twice the potential gain). There are many reasons why this is advantageous:
- Commissions on the trades are negligible.
- Many of the trades will fall into long-term capital gains category (which reduces the tax rate - based on current tax law).
- The psychological impact of a draw down ( a draw down is when you have a paper loss, not an actual loss ) is reduced because there is plenty of time to "right the ship".
The second foundational pattern to be aware of is, I WILL experience a draw down. A draw down is an imaginary loss. Real losses or gains are only calculated when you actually buy and sell something. Let's take a look at a recently completed trade as an example:

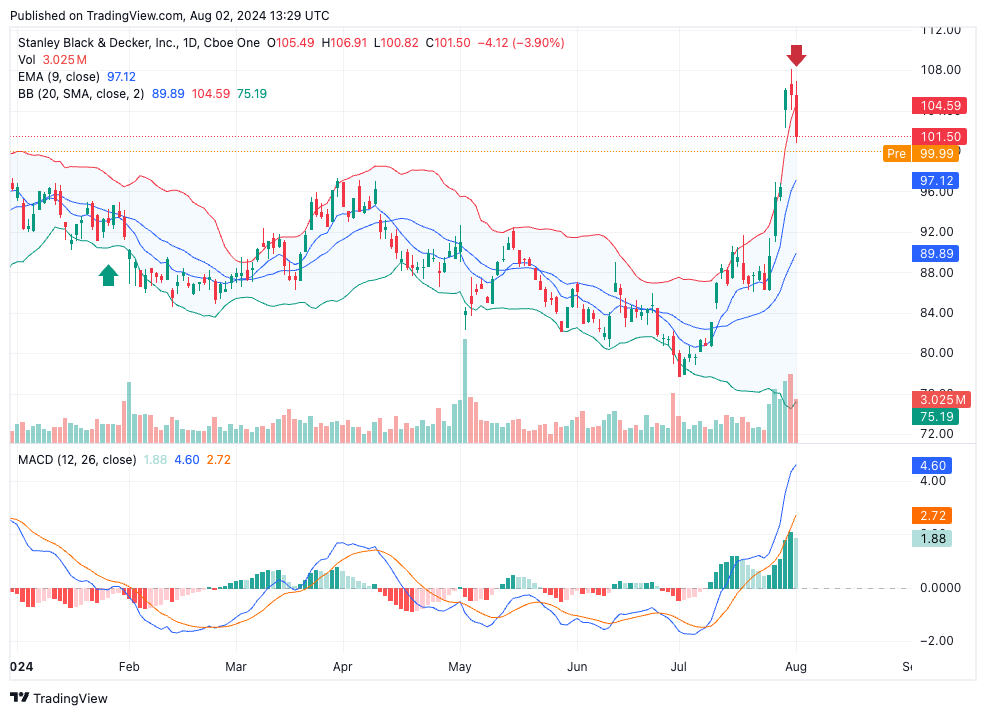
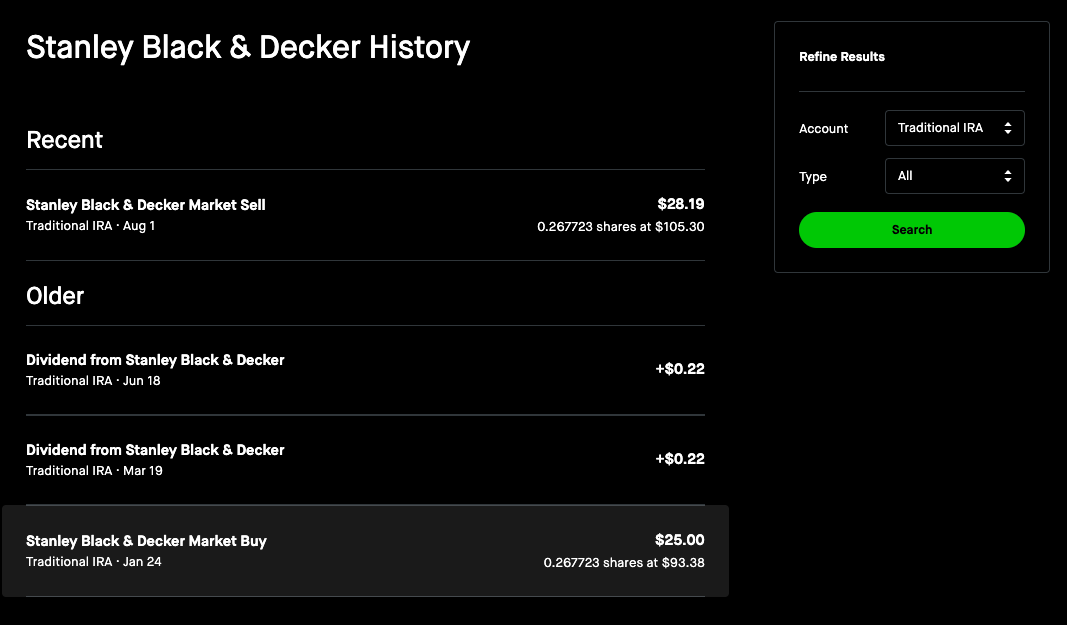
This trade of Stanley Black & Decker started on January 24th, 2024, and finished on August 1st, 2024. Compared to most trades, the period between entry and exit was very brief (210 days). The trade resulted in a gain of 14.52%. This is a screenshot of the start and end plus dividend payments for the actual trade:

It should be noted that, during almost the entirety of this trade, I was in a draw down situation (an imaginary loss). In many cases, I will experience practically no draw down during the life of the trade. Here is an example that is still in progress:

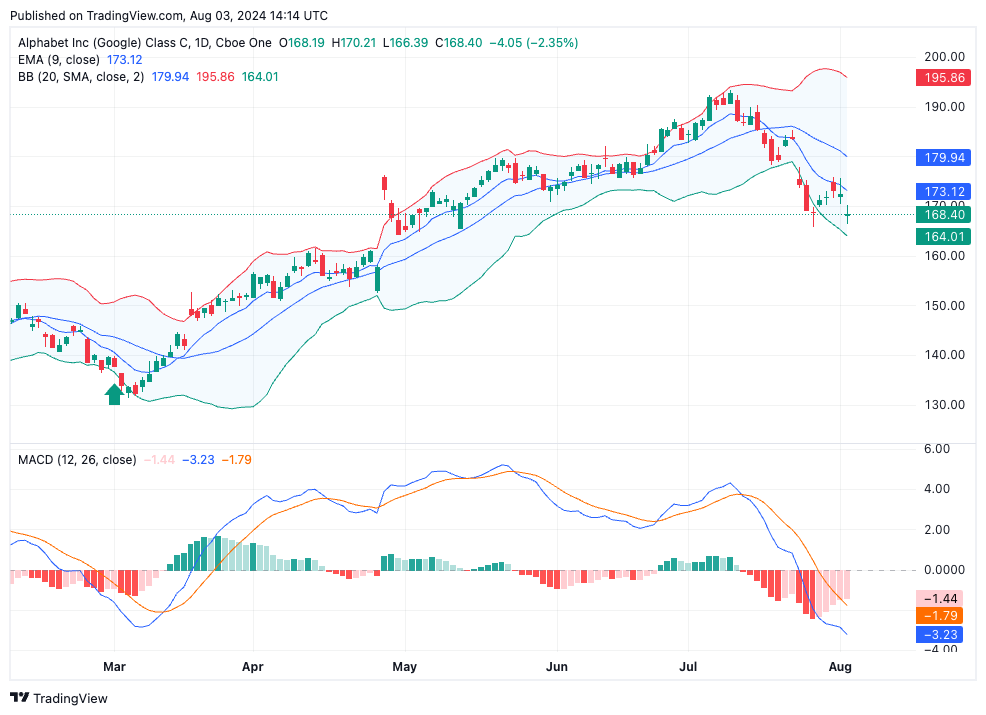
This trade of Google started on 3-1-2024 (the day after the signal was generated) and had a brief draw down as you can see from the chart, but other than that, I experienced mostly an imaginary gain so far. This is the actual trade in progress in my IRA:


Market psychology is a big issue with trading. It is very hard for me to control my emotions when based on a single trade, the value of my account swings up and down wildly. When I experience a large draw down within a single trade and I have invested a large amount of capital, I become a slave to that trade. This is why, for every signal generated by my algorithm, I only invest a small percentage of my capital. If you invest half a percent of your working capital in any individual trade, even if that company you invested in goes belly up bankrupt, you only lost half a percent.
There are currently 292 open trades generated by my algorithm. I trade every signal that is generated. Because of this, and when I started trading, I currently have 89 open positions in various stocks and ETFs. Even though I am playing with a small amount of money, I am extremely diversified. For any draw down, it has a small impact on my psychology when over-all my portfolio has positive gains.
So this is a third pattern that I must identify when I use my algorithm to trade. Diversification is a mechanism for controlling risk. I am not psychologically vulnerable to the "slings and arrows of outrageous mis-fortune".
How, exactly, am I able to diversify my trades with such a small amount of money is going to be the subject of another article (coming shortly).
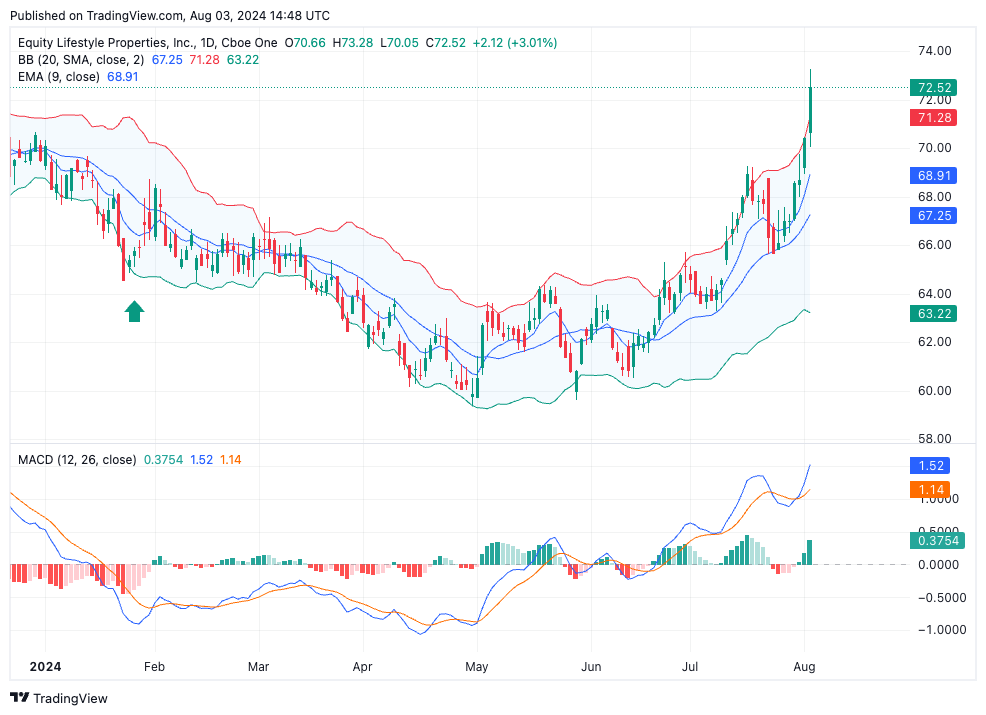
The fourth pattern I have identified with my trades is that my algorithm can "See" what the smart money is doing and identify the trade very early on. For instance, it will frequently start a trade in the left shoulder of a head and shoulders pattern or a double bottom or other major chart patterns like this:

Do you see the double bottom and how early the signal was? Did you see the reverse head and shoulders when I traded SWK?
As a guide to myself, I will summarize with the following observations:
- Be patient.
- Don't sweat the small stuff.
- Be positive even when it feels like you are sucking on a lemon (make some lemonade).
- Don't put all your eggs in one basket.
- Life is like a box of chocolates, you never know what you are going to get.
Have a great day!!
-- The Management
Member discussion