Introducing a New (Beta) Feature: Dollar Cost Averaging

Dollar Cost averaging is used by many sophisticated investors as a method for improving the price that is paid for anything sold in modern financial markets. I am introducing this information because it greatly improves the trading results.
The way that Dollar Cost averaging will be applied by my algorithm is as follows:
- If the same rules that triggered entry also trigger again (before an exit is generated).
- And if the price at which the subsequent entry is generated is better (lower) than the original price.
- a Dollar Cost Average will show on the daily report which if used can lower the average price of the cost of your shares.
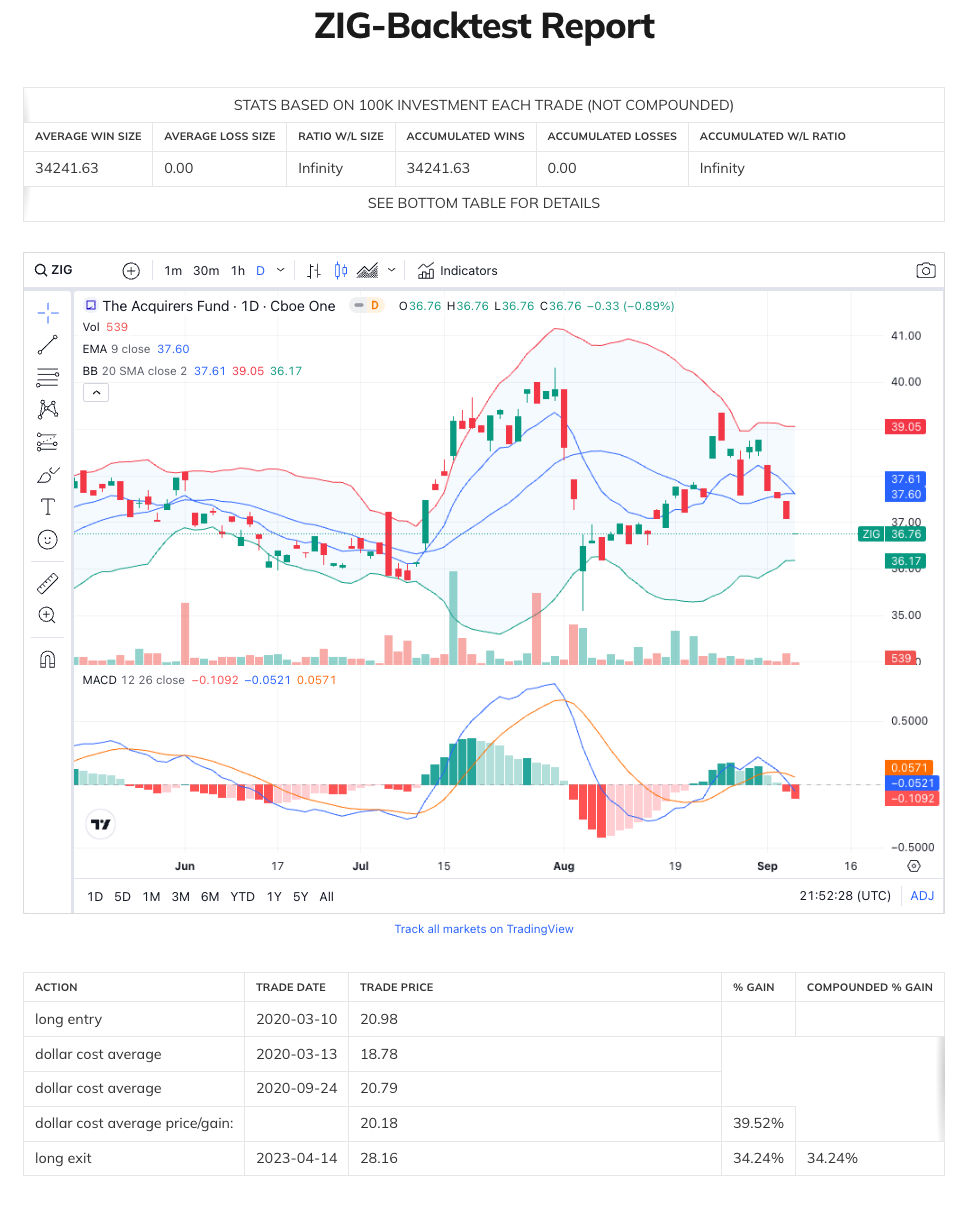
Let's take the following back test as an example:

The way to interpret this backtest is:
- A long entry for ZIG was signaled on 3-10-2020 and the price the next morning (at entry) was 20.98.
- Subsequently I had two opportunities to buy again at lower cost (using the same set of entry criteria as the original entry.
- Taking advantage of those additional opportunities I bought stock again at 18.78 and 20.79.
- The average cost of all shares in ZIG was 20.18 at the time I got an exit signal.
Because my average price per share dropped from 20.98 (at the very first trade) to 20.18 (the cost of all entry trades averaged), I improved the profitability of the trade by 5.28%. Instead of a profit on exit of 34.24%, there was a profit of 39.52%.
Now there is nothing forcing me to use dollar cost averaging. I can just stick to the original methodology which would be to buy only when I get a signal for "long entry" and to sell when I get a "long exit".
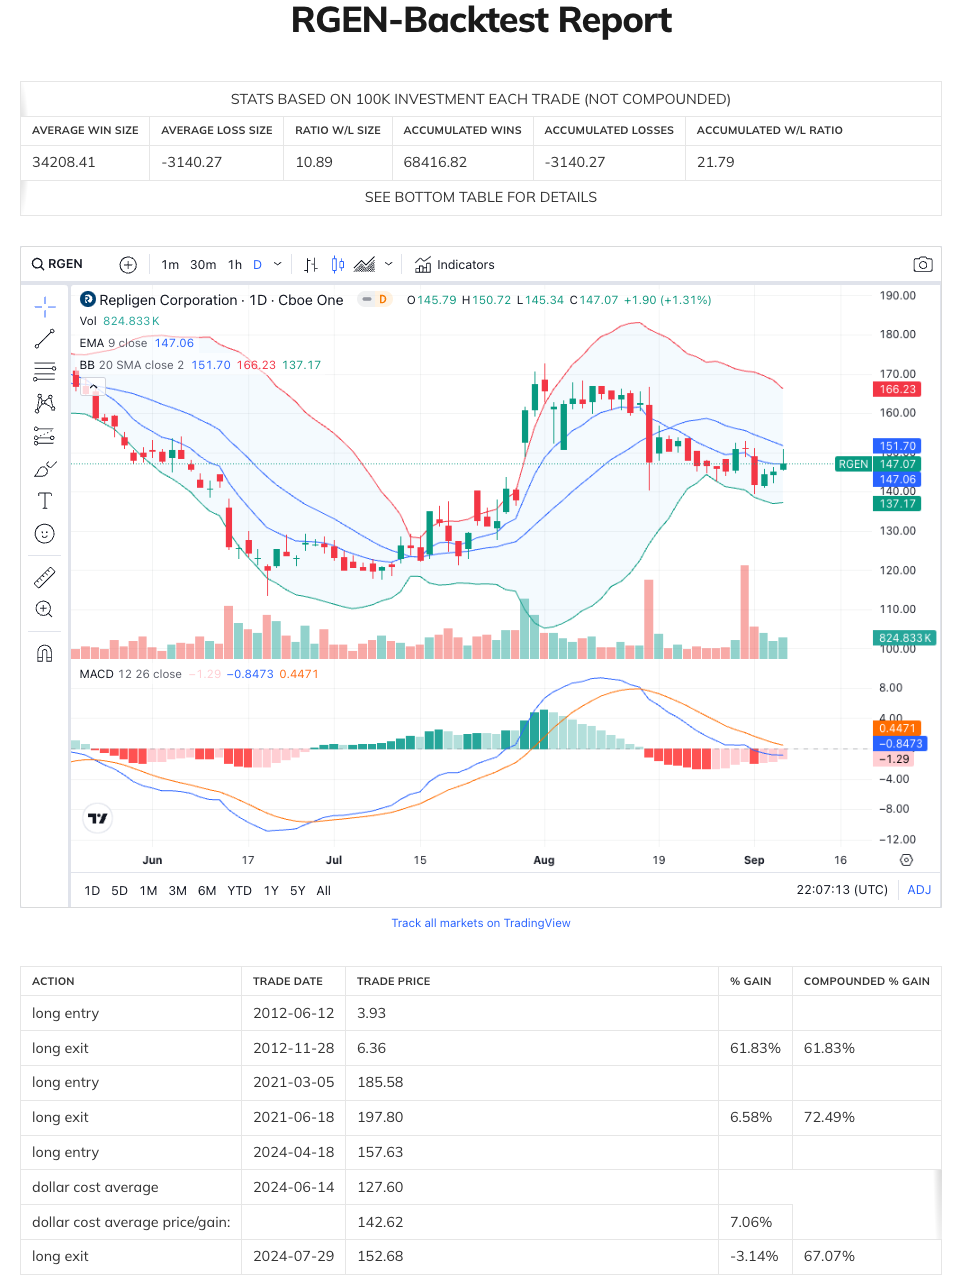
Dollar Cost averaging can also turn a loss into a win, or reduce the size of a loss. Here is an example of turning a loss into a win:

Notice that I had a long entry on 04-18-2024 at 157.63 and afterward I had another opportunity to dollar cost average into RGEN at the price of 127.60 based on the signal generated on 06-14-2024. This lowered the average cost of shares from 157.63 to 142.62. I then got a long exit signal to sell on 07-29-2024 at 152.68. If the average share cost had been 157.63 (based on the initial trade), there would have been a -3.14% loss realized. Instead, by dollar cost averaging, a 7.06% gain could be realized at an average share price of 142.62.
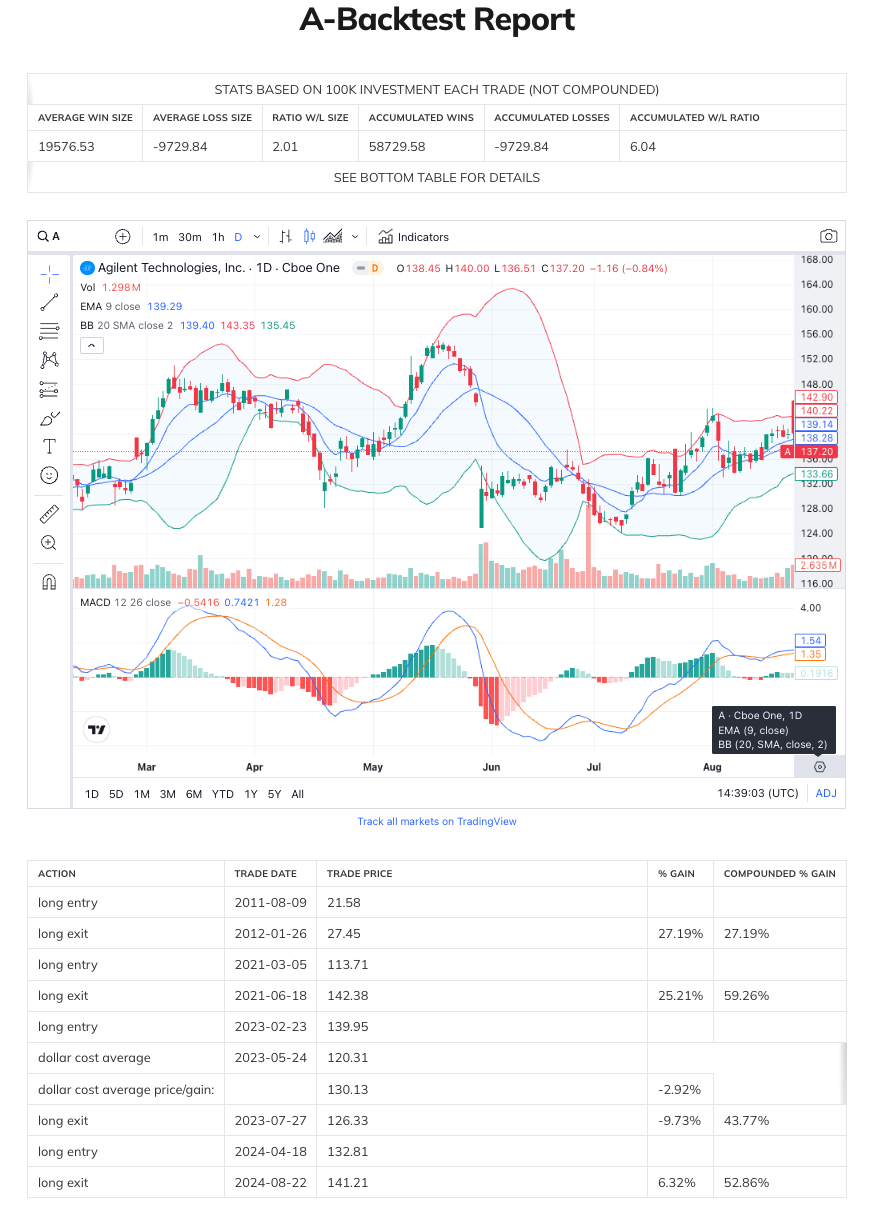
Lastly, the size of a loss can be reduced if I use dollar cost averaging:

In the case of trading Agilent, please notice that there was an entry initially on 02-23-2023 at 139.95 and an opportunity to dollar cost average in at the price of 120.31 on 05-24-2023. This reduced the average cost per share to 130.13. The exit was triggered at the price of 126.33. Instead of a loss of -9.73% it was a loss of -2.92%.
As you can see, dollar cost averaging provides an opportunity to improve results. In addition to adjusting the daily report, I am updating all back tests to include the dollar cost averaging results.
This is a beta test feature. We are including it and testing it (for now). When we are satisfied with the implementation, we will make it a permanent feature and use it to help calculate the trade statistics in the back testing.
I hope you enjoy this new and entertaining option.
Kind regards,
-- The Management
Member discussion